Protein per 100 g: dried cheese, cheese, meat, fish, nuts and snacks
Українська · English · Deutsch · Polski · Slovenčina
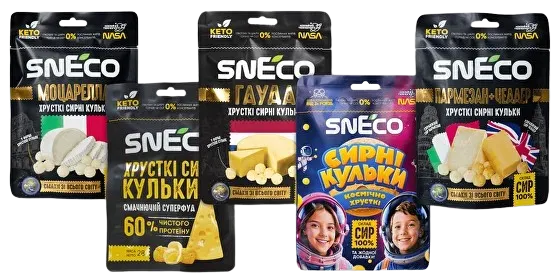
100 g of snEco dried cheese contains 27 to 53 g of protein depending on the flavour. That is about twice as much as fresh cheese of the same kind: snEco dried Gouda has 48.3 g, fresh Gouda 24.9 g. For comparison: chicken breast 31 g, beef 29.5 g, almonds 21.2 g, potato chips 6.4 g.
| Food | Protein, g | Fat, g | Carbs, g | Protein per 30 g handful, g |
|---|---|---|---|---|
| snEco Primaggio, dried cheese | 53.4 | 42.2 | 1.5 | 16.0 |
| snEco smoked Suluguni, dried cheese | 52.0 | 40.0 | 2.0 | 15.6 |
| snEco Mozzarella, dried cheese | 49.4 | 44.1 | 1.5 | 14.8 |
| snEco Gouda, dried cheese | 48.3 | 44.2 | 1.5 | 14.5 |
| snEco Cheddar, dried cheese | 42.3 | 46.8 | 1.5 | 12.7 |
| Parmesan, hard cheese | 35.8 | 25.0 | 3.2 | 10.7 |
| Beef jerky | 33.2 | 25.6 | 11.0 | 10.0 |
| snEco Blue Royale, dried blue cheese | 31.7 | 51.0 | 1.0 | 9.5 |
| Chicken breast, roasted | 31.0 | 3.6 | 0.0 | 9.3 |
| snEco mix: Suluguni + peanuts | 30.8 | 46.0 | 13.8 | 9.2 |
| Pumpkin seed kernels | 30.2 | 49.0 | 10.7 | 9.1 |
| Beef top sirloin, broiled | 29.5 | 6.7 | 0.0 | 8.9 |
| snEco mix: Mozzarella + cashews | 28.8 | 43.0 | 12.0 | 8.6 |
| snEco mix: Primaggio + walnuts | 28.8 | 55.8 | 11.5 | 8.6 |
| snEco mix: Gouda + hazelnuts | 27.5 | 58.0 | 7.0 | 8.2 |
| snEco mix: Cheddar + almonds | 27.0 | 50.4 | 9.0 | 8.1 |
| Swiss cheese (Emmental type) | 27.0 | 31.0 | 1.4 | 8.1 |
| Tuna, canned in water, drained | 25.5 | 0.8 | 0.0 | 7.7 |
| Gouda cheese | 24.9 | 27.4 | 2.2 | 7.5 |
| Peanuts, dry-roasted | 24.4 | 49.7 | 21.3 | 7.3 |
| Cheddar cheese, sharp | 24.2 | 33.8 | 2.1 | 7.3 |
| Mozzarella, whole milk | 22.2 | 22.1 | 2.4 | 6.7 |
| Atlantic salmon, farmed, cooked | 22.1 | 12.3 | 0.0 | 6.6 |
| Blue cheese | 21.4 | 28.7 | 2.3 | 6.4 |
| Almonds | 21.1 | 49.9 | 21.6 | 6.3 |
| Tofu, firm | 17.3 | 8.7 | 2.8 | 5.2 |
| Cashews, dry-roasted | 15.3 | 46.4 | 32.7 | 4.6 |
| Popcorn, air-popped | 12.9 | 4.5 | 77.8 | 3.9 |
| Egg, hard-boiled | 12.6 | 10.6 | 1.1 | 3.8 |
| Cottage cheese, 2% fat | 10.4 | 2.3 | 4.8 | 3.1 |
| Greek yogurt, plain, nonfat | 10.2 | 0.4 | 3.6 | 3.1 |
| Lentils, boiled | 9.0 | 0.4 | 20.1 | 2.7 |
| Potato chips, salted | 6.4 | 34.0 | 53.8 | 1.9 |
Why dried cheese has more protein
Drying removes water from the cheese while protein and fat stay. So 100 g of the finished product contains more of both, just like jerky or dried fruit. snEco dries natural cheese by microwave vacuum drying at 36–38 °C, without oil and without frying. Fat is concentrated too, which is why a usual serving is 14–30 g rather than 100 g.
How to read the table
All values are per 100 g of food as eaten: meat and fish cooked, lentils boiled. The “30 g handful” column shows how much protein a usual snack serving gives. snEco mixes contain nuts, so they have less protein and more carbohydrates.
Sources and method
snEco data: the nutrition declaration on the 14 g and 20 g pack labels (packaging artwork as of 01.10.2026). Other foods: USDA FoodData Central, SR Legacy dataset (April 2018); the record number of each item is in the CSV. Values rounded to 0.1 g. Checked 01.10.2026.
Free to use
You may quote, translate and embed this table with a link to this page (CC BY 4.0 licence). Data as CSV: protein-per-100g.csv.
Read also: How much protein is in cheese · Protein snack · Keto snacks · What is dried cheese
Updated 01.10.2026.